The T&M Reports screen offers a comprehensive view of the consolidated cost details for Time and Material (T&M) work carried out by contractors on the project so far.
- General Contractors can access and review the cost details for T&M work performed by all subcontractors involved in the project.
- Subcontractors can view only the cost details related to their own T&M work.
To view the T&M Reports
- Ensure that you are in the T & M management module of the project. If not,
- Click the main menu at the top-left
- Click 'T & M' under 'Financials & Controls' in the menu drop-down. The 'Boards' screen opens by default.
- Select 'Reports' from the left.
- Click the main menu at the top-left
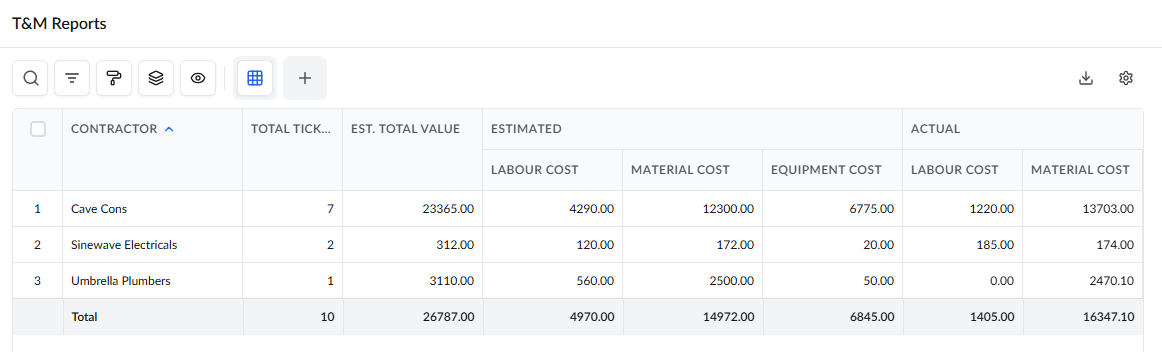
- Contractor - Displays the name of the general contractor or subcontractor company.
- Total Tickets - The total number of T&M tickets associated with the contractor that have been completed, closed, and approved.
- Est. Total Value - The combined estimated value of all closed T&M tickets submitted by the contractor.
- Estimated - Provides a detailed breakdown of the estimated costs for labor, material, and equipment across all approved tickets.
- Actual - Displays the consolidated actual costs incurred for labor, material, and equipment based on all approved tickets submitted by the contractor.
Search, Filter, and Sorting Options
- Click the magnifier icon and use the 'Search' box located at the top left to find an entry using any value from the table as search criteria
- Click any column header to sort the rows in ascending or descending order based on that column's data.
- Click the cog wheel icon at the top right to adjust the display density and customize the display and order of the columns. See Customize Columns in List Views.
- The options at the top left allow you to filter the entries, create nested groups of entries, highlight cells and manage personalized and customized views of the table. Use the links below to learn more:
- Get totals and subtotals of numerical data for any selected set of records by grouping and applying nested grouping.
- Use the
 icon at the top right to organize the data by column headers. The system automatically aggregates relevant numerical values, giving a structured breakdown and a clear view of the grand total distribution. See Group and Organize Items in a List View
for more details
icon at the top right to organize the data by column headers. The system automatically aggregates relevant numerical values, giving a structured breakdown and a clear view of the grand total distribution. See Group and Organize Items in a List View
for more details
- Click the 'Download' icon at the top right to save a local copy of the list in Excel format for sharing and record-keeping. See Download List Views and Logs in Excel Format for more details
Was this article helpful?
That’s Great!
Thank you for your feedback
Sorry! We couldn't be helpful
Thank you for your feedback
Feedback sent
We appreciate your effort and will try to fix the article